The biggest economic crisis since World War II simply must be overcome.
We can see light at the end of the tunnel so far as the coronavirus is concerned. We look for a substantial relaxation of containment measures by the end of May, or at the latest by the end of June. In the meantime, governments around the world have to prevent a global wave of bankruptcies.
Business cycle indicators have collapsed
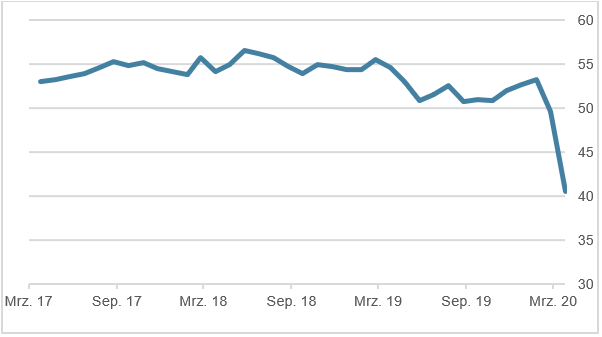
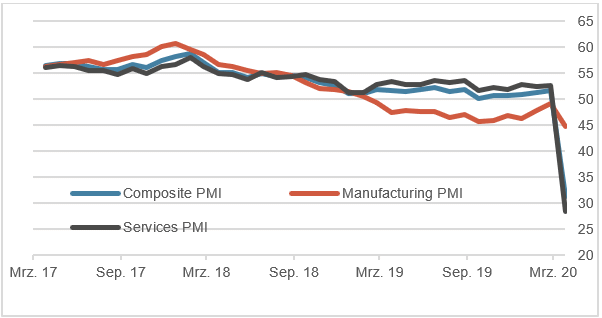
The economic damage caused by the combination of the corona pandemic and the resulting containment measures (“social distancing” and “lock downs”) can clearly be seen in economic indicators such as the Purchasing Manager indices for the US and Euroland which are shown in charts 1 & 2.
US jobs market is in shock
The US labor market is in shock. In the week to March 28 the number starting to claim unemployment benefit rose by 6.6 million, 3.3 million more than in the prior week.
This massive rise did not reflect the usual cause of rising claims, a bad economy, but rather the containment measures aimed at slowing the virus. With unemployment now rising so sharply, the US will likely have a severe recession lasting at least one to three quarters.
Graph 1 Purchasing Managers’ index – US
Graph 2 Purchasing Managers’ indices – Euroland
Light at the end of the tunnel?
Critical for the further development of the economic crisis will be the course of the pandemic. When might the lockdowns end? Maybe the experience of China provides the best answer we are likely to find. In Wuhan, the capital of Hubei province, where the virus started, it took around seven weeks to bring the outbreak under control.
The market now seems to sense “the beginning of the end” of the pandemic. But while social distancing seems to have slowed the spread of the virus in all countries, the lockdown in Hubei was more radical than anything that could be introduced in the West. In China, even the death sentence was imposed! With its looser containment policies, the West is likely to take longer than China to bring the virus under control
First in, first out
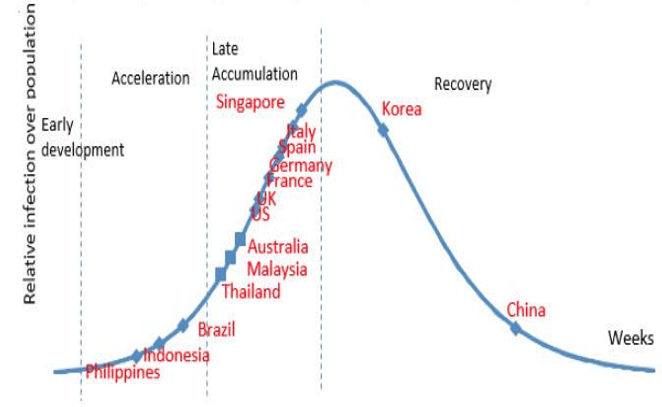
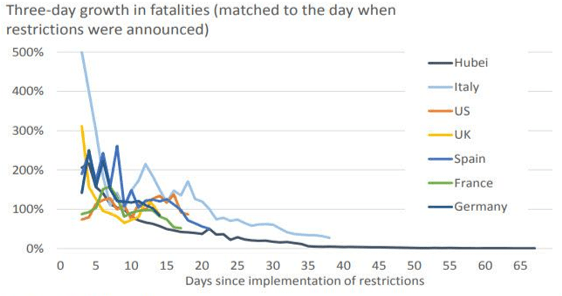
Graph 3 overleaf tries to classify countries schematically and chronologically, according to the principle “first in, first out”. Graph 4 shows that the spread of the pandemic across the world has broadly mirrored what happened in China. Therefore, it is reasonable to forecast that future developments outside China will also reflect the Chinese experience.
Figure 3: Timing of the pandemic by country
Source: JP Morgan
Graph 4: Tracking the course of the pandemic
Source: Deutsche Bank
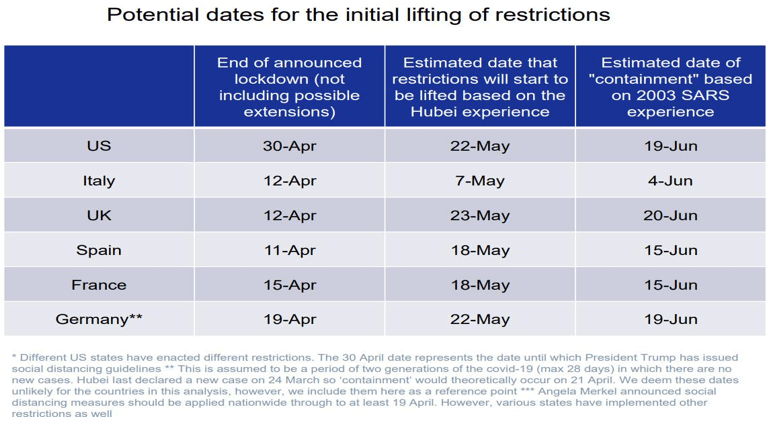
If one accepts developments in Wuhan as the template, one might posit the timetable for the lifting of restrictions shown in Graph 5. (Source: Deutsche Bank).
Graph 5: Projecting the relaxation of restrictions in key countries
Response to the Pandemic I: rescue packages
The fiscal toolbox has been fully utilized with huge bailout packages being passed around the world. This is an attempt to prevent a threatened wave of bankruptcies.
Response to Pandemic II: Central banks have launched unprecedented security purchase programs and financial injections
Fiscal rescue packages take time to impact an economy. For example, credit applications must be first lodged and then processed. But central banks can react immediately, and they have started gigantic asset purchase programs aimed at “thawing” the credit markets. Bypassing the traditional banking system, ever more central banks are starting to behave as “corporate credit banks”. In a nutshell, central banks are buying up “everything” in the fight against the coronavirus.
If only temporarily, stock markets now seem to have decoupled from the real economy. Perhaps some investors even expect that the Fed and other central banks will soon be buying shares directly. Extreme portfolio positions in one direction or another (extreme overweight or extreme underweight) are dangerous. But for now, the logic that “bad economic news is good news for shareholders” looks again like holding true, at least as long as central banks are determined to “stimulate all they can”.
Two extreme scenarios: (i), just two years of missed dividends valued with a dividend discount model and (ii), a major depression
If all companies could be saved and the economic downturn lasted “only” two years, the theoretical effect might be limited to just two years of dividends foregone. Assuming a dividend yield of 3%, the corona crisis might then “only” amount to stock prices just 6% lower than they would have been with no coronavirus. (The fair value of a stock index is calculated on the basis of all future discounted dividends. If only two annual dividends are lost, the effect is small.) This is an extremely positive scenario.
The obvious extremely negative one is a “Great Depression” with mass unemployment, defaults on many bonds and many corporate bankruptcies.
We remain tactically underweight in equities and overweight in gold. We think convertible bonds offer an attractive risk-reward ratio.
Contact: Thomas Härter, CIO, Investment Office
Telephone: +41 58 680 60 44
Disclaimer: Information and opinions contained in this document are gathered and derived from sources which we believe to be reliable. However, we can offer no undertaking, representation or guarantee, either expressly or implicitly, as to the reliability, completeness or correctness of these sources and the information provided. All information is provided without any guarantees and without any explicit or tacit warranties. Information and opinions contained in this document are for information purposes only and shall not be construed as an offer, recommendation or solicitation to acquire or dispose of any investment instrument or to engage in any other transaction. Interested investors are strongly advised to consult with their Investment Adviser prior to taking any investment decision on the basis of this document in order to discuss and take into account their investment goals, financial situation, individual needs and constraints, risk profile and other information. We accept no liability for the accuracy, correctness and completeness of the information and opinions provided. To the extent permitted by law, we exclude all liability for direct, indirect or consequential damages, including loss of profit, arising from the published information.
Disclaimer: Produced by Investment Center Aquila Ltd.
Information and opinions contained in this document are gathered and derived from sources which we believe to be reliable. However, we can offer no under-taking, representation or guarantee, either expressly or implicitly, as to the reliability, completeness or correctness of these sources and the information pro-vided. All information is provided without any guarantees and without any explicit or tacit warranties. Information and opinions contained in this document are for information purposes only and shall not be construed as an offer, recommendation or solicitation to acquire or dispose of any investment instrument or to engage in any other trans
action. Interested investors are strongly advised to consult with their Investment Adviser prior to taking any investment decision on the basis of this document in order to discuss and take into account their investment goals, financial situation, individual needs and constraints, risk profile and other information. We accept no liability for the accuracy, correctness and completeness of the information and opinions provided. To the extent permitted by law, we exclude all liability for direct, indirect or consequential damages, including loss of profit, arising from the published information.


